

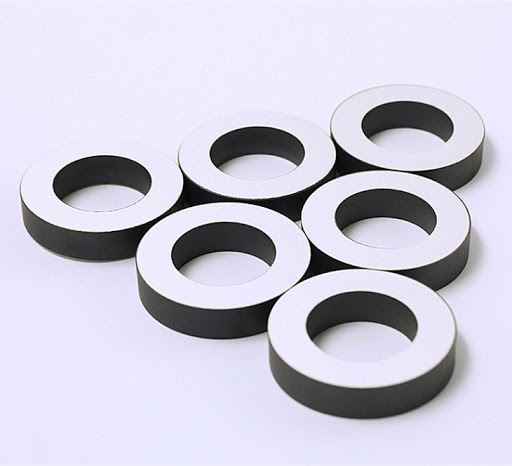
Impedance testing checks piezoelectric ceramic components by measuring how their electrical response changes with frequency. A useful inspection compares the complete resonance curve—not just one frequency or capacitance reading—with an approved reference measured under the same conditions. Resonance shifts, increased losses, or unexpected peaks can flag a component for investigation, but they do not identify a defect on their own.
The central requirement is repeatability. Fixture pressure, temperature, electrical contact, excitation level, and mechanical loading can change the result enough to resemble a material problem. A dependable acceptance decision therefore needs both a defined measurement method and component-specific limits. Passing a low-signal impedance test does not, by itself, demonstrate insulation safety or reliability at operating power.
What the impedance curve actually reveals
A piezoelectric element converts an applied alternating voltage into mechanical motion. Near a mechanical resonance, that motion strongly affects the current drawn from the instrument. Measuring complex impedance, Z = R + jX, across frequency reveals this interaction through impedance magnitude, phase, resistance, and reactance.
For an isolated vibration mode, the response can be represented by a Butterworth–Van Dyke equivalent circuit: a static capacitance in parallel with a motional branch containing resistance, inductance, and capacitance. The motional branch represents mechanical losses, inertia, and compliance as electrical quantities. This model becomes less reliable when several modes overlap or when a complete assembly introduces additional mechanical behavior.
The most useful inspection parameters are:
Recording only the frequency of the lowest impedance discards useful evidence. Two parts can share nearly the same resonance frequency while differing substantially in loss, peak shape, or antiresonance behavior.
Define the component state before measuring it
A bare ceramic ring, a bonded sensing element, and a bolt-clamped ultrasonic transducer are different test objects. Their results should not share acceptance limits simply because they contain the same ceramic material.
For a bare element, specify whether it is free, lightly supported, or clamped. Support position matters because contact at a region of high vibration can damp the mode. Electrode contacts should provide stable electrical continuity without imposing uncontrolled force on the ceramic.
For an assembled transducer, define the mechanical configuration: preload, housing, backing, matching layers, attached horn, and external load. In welding equipment, changing the horn or stack configuration changes the measured system. In an immersed ultrasonic device, a measurement in air is not interchangeable with one under a specified liquid load.
The test record should also identify the ceramic geometry, electrode arrangement, intended vibration mode, and polarization direction. A disc can exhibit radial and thickness-related modes in different frequency regions. Selecting the deepest dip without identifying the intended mode can produce a plausible but irrelevant acceptance result.
Set up a measurement that can be reproduced
Use an impedance analyzer, or a frequency-response measurement system with a validated impedance fixture, covering the required frequency and impedance ranges. An LCR meter is useful for a specified off-resonance capacitance check, but a single-frequency reading cannot replace a resonance sweep.
Allow the instrument to stabilize according to its operating instructions. Perform the required open, short, and, where supported or required, load compensation at the actual measurement plane. Include the cables and fixture used for inspection. Compensation at the instrument connector does not remove every error introduced farther along the connection.
Short, stable connections are especially important near resonance and antiresonance. Lead inductance can distort a low-impedance resonance; stray capacitance can distort a high-impedance antiresonance. Use a four-terminal-pair or other appropriate connection where supported, and follow the instrument’s shielding and grounding instructions.
Verify the setup with a stable reference component whose curve has already been characterized. This checks more than the instrument calibration: it can reveal fixture wear, contact problems, or an unintended software setting. The reference should have its own control history rather than being assumed permanently unchanged.
Control and record temperature. If parts have just undergone heating, bonding, cleaning, or powered operation, allow them to reach the specified test condition. Where moisture conditioning or storage time affects the product, include those conditions in the method as well.
Use a defined small-signal excitation for routine screening. Piezoelectric response can depend on drive level, so an unexplained change in excitation invalidates comparison with earlier results. Check whether the instrument controls voltage, current, or another quantity, and whether the stated voltage is actually maintained across the device throughout the sweep. Near resonance, current can increase significantly.
Before connecting a previously energized component, isolate it from equipment and discharge it using an appropriate controlled method. Piezoelectric elements can retain charge and can generate voltage when mechanically stressed. Avoid uncontrolled shorting or handling that could damage electrodes or expose the operator to stored energy.
Use a broad search, then resolve the selected resonance
Start with a sweep wide enough to locate the expected mode and nearby responses. This prevents a shifted resonance from falling outside a narrow inspection window and helps distinguish the intended mode from a neighboring one.
Then perform a finer sweep around the selected resonance and antiresonance. Frequency spacing must resolve the peak width, not merely locate a low point. A coarse sweep can miss the true minimum, underestimate peak height, or make a narrow resonance appear broader than it is.
Choose settling time and measurement speed to suit the component. A high-quality-factor mode stores mechanical energy and needs sufficient time to stabilize after a frequency change. Excessively fast sweeping can distort the response. If a trace changes with sweep direction or speed, establish whether the cause is measurement settling, heating, nonlinear response, or instability before treating it as a product defect.
Save magnitude and phase, along with resistance and reactance where available. Retain the raw sweep, not only the instrument’s extracted values. Automatic peak selection can switch between adjacent modes when their relative amplitudes change.
A useful repeatability check is to disconnect and remount the same part, then measure it again. If the result changes materially after remounting, the fixture or contact method needs improvement before tighter product limits can be justified.
Interpret deviations without turning symptoms into diagnoses
A frequency shift indicates a change in the effective mechanical system, but the source may be dimensional variation, stiffness, temperature, mounting, preload, or added mass. It should not immediately be labeled depolarization or cracking.
Higher motional resistance or a broader resonance can indicate increased damping. In an assembly, that damping may come from adhesive, backing, mechanical joints, or external loading rather than the ceramic itself. A poor electrical connection can also distort the trace and must be excluded.
Additional peaks or a split response deserve investigation when they differ from the approved pattern. Cracks, asymmetry, and bonding irregularities can alter vibration modes, but intact components can also have multiple legitimate resonances. The relevant question is whether the new feature is repeatable under controlled conditions and inconsistent with the qualified design.
A changed capacitance reading may reflect electrode area, thickness, dielectric properties, temperature, or connection quality. Substantial loss of electrical continuity can reduce measured capacitance, but capacitance alone cannot establish the condition of the polarized ceramic.
When an abnormal trace appears, repeat the measurement with verified contacts and unchanged settings. Check the reference component, inspect the suspect part, and confirm its conditioning and assembly state. A persistent deviation should trigger a defined disposition process rather than repeated testing until one result passes.
Calculate coupling and quality factor only with a valid method
The separation between resonance and antiresonance contains information about electromechanical coupling. However, the conversion to a coupling coefficient depends on vibration mode, geometry, and the definitions used for the characteristic frequencies.
The expression keff2 ≈ 1 − (fs/fp)2 can serve as an effective coupling estimate for an appropriate simplified resonator model. It is not a universal substitute for material coefficients such as kt or kp. Using the wrong mode-specific equation can make otherwise sound measurements misleading.
Likewise, a bandwidth-based quality factor requires a suitable isolated resonance and a correctly defined response quantity. Applying a generic −3 dB rule directly to any impedance-magnitude trace is not sufficient. Equivalent-circuit fitting can estimate motional parameters, but the fitted curve and residual errors should be checked; a numerical result does not prove that the model describes overlapping modes correctly.
IEC 60483 provides guidance on dynamic measurements of piezoelectric ceramics with high electromechanical coupling. Its applicability should be checked against the component and measurement being performed. The controlled inspection procedure should identify the applicable standard edition, calculation method, frequency definitions, and any deviations. A measurement standard does not supply universal acceptance limits for every ceramic design or assembled transducer.
Turn the measurement into a defensible release decision
Acceptance limits should come from the drawing, agreed specification, or qualified product baseline, supported by the application’s operating requirements. A resonant drive system may require a restricted frequency window, while another design may place greater emphasis on loss or response consistency. One tolerance cannot meaningfully cover every application.
Separate product variation from measurement variation. Evaluate repeat measurements, remounting, different operators, and relevant fixtures. If measurement uncertainty occupies a substantial portion of the tolerance, a pass/fail decision near the boundary is weak. The procedure should define any guard band, retest conditions, and treatment of borderline results.
Maintain traceability through the component or lot identifier, instrument and fixture identification, compensation status, environmental conditions, excitation, sweep settings, raw curve, extraction method, and disposition. This makes supplier and receiving-inspection results comparable. A disagreement cannot be resolved reliably by exchanging resonance numbers without their test conditions.
Small-signal impedance screening remains only one part of qualification. It does not directly demonstrate dielectric withstand, insulation resistance, high-power temperature rise, mechanical fatigue, or durability under the intended load. High-power ultrasonic assemblies need separate validation at defined operating conditions, with appropriate protection against hazardous voltages, hot surfaces, and unintended vibration.
A release decision is strongest when the expected resonance behavior is reproducible, deviations have defined limits, and abnormal results lead to controlled investigation. The impedance curve then becomes evidence of component consistency—not an unsupported claim that every hidden defect or operating risk has been ruled out.

Thank you very much for writing to us. Please leave your message and contact information, we will reply to you within 24 hours.